On this topic. how to write your presentation of Data.
First off, you need to have treated you raw information first. These are encoded (in MS Excel) survey results for quantitative. And transcriptions (in MS Word) for qualitative.
QUALITATIVE TREATMENT
Transcriptions should have participant profiles at the beginning of the page just right before the actual transcription of the recording. These include code name, what is this resource person (work/ affiliation) and other demographics (age, gender, etc.) that are RELEVANT to the study. Again, only the RELEVANT ones.
Thematiing
The usual step in analysis qualitative data is through thematization of the statements.
Once transcribed, you subject the statements into the 1st stage of analysis called "cool analysis."
Cool analysis is reading and highlighting text that are significant to your research topic. In MS Word, you do this by commenting using the review tool. What comment you write is based on codes. Either you begin with a predertermined set of codes (closed coding) or you just make codes as you progress (open coding). Closed codes are used in phenomenology, narrative, and case study research designs. Open coding is mainly used in grounded theory.
For your thesis you will both use closed and open codes. The closed codes are themes that come from the conceptual framework. That's why it's called a 'framework.' It frames the thesis. And Chapter IV is the part which contains the actual body of data o the thesis. You will also use open codes because, there will always be new information.
So, what's happening is, you are affirming the theory by checking out if the field does match the concepts of the theory. Then, you add to, if there is any new information. Remember, the conceptual framework was guided by the theory you proposed to use in the previous chapters. Here is the part where you check if the theory is true or false, or if there is any twist to the theory since you have conducted a new research.
After reading and highlighting, you reread the material, and align the codes you used. e.g. You might have used the word "development" once, and realized that on the next set of highlights, you used the word "growth" as a code. And you realize that the actual term you want to use is development. So you check them. This is already warm analysis.
Instead of simply using MS Word, you could use MaxQDA or any other software. I, for one, use MaxQDA. It will not think for you, but it will help in processing the highlighted data with codes and lines of connections, and even summary lists of codes and their respective quotes. You can see me in person for MaxQDA basic learning.
 |
| Sample Excel tabulation of themes. Notice that I've added filter tools to the headings of the top row. Those help in sorting the date. It will arrange them based on theme, sub-theme, etc. |
Once done with the warm analysis, you harvest the highlighted statements by copy pasting each statement segment to an excel file.
You will have around 3 - 4 columns. 1st column is the transcription source. Best is to fix the way you classify the source. E.g. Brgy Chair 1 (code name) Ambassador 2 (code name) Ambassador 1 (code name). This will help you sort them one everything is in the excel.
2nd Column is the quote or statement segment. It can be a sentence or part of it, or a paragraph. It depends on how significant it is.
3rd column will be the corresponding theme.
4th column will be based on another set of analysis. 4th column may or may not be optional. It depends on the data. One sample is, as you look at all the themes, you might find that some themes belong to a superset or category, so, classify them as such. e.g. themes are fine, award, warning, compliant, subversive, brgy, women's association. You classify fine, award, and warning under "responses."
Sometimes, the reverse is what's happening with the data, you will notice, that there are sub-categories under one theme, that you just create as you reread the excel file. You just do so. Hence, under fine, you can make specifics such as 500, 1,000.
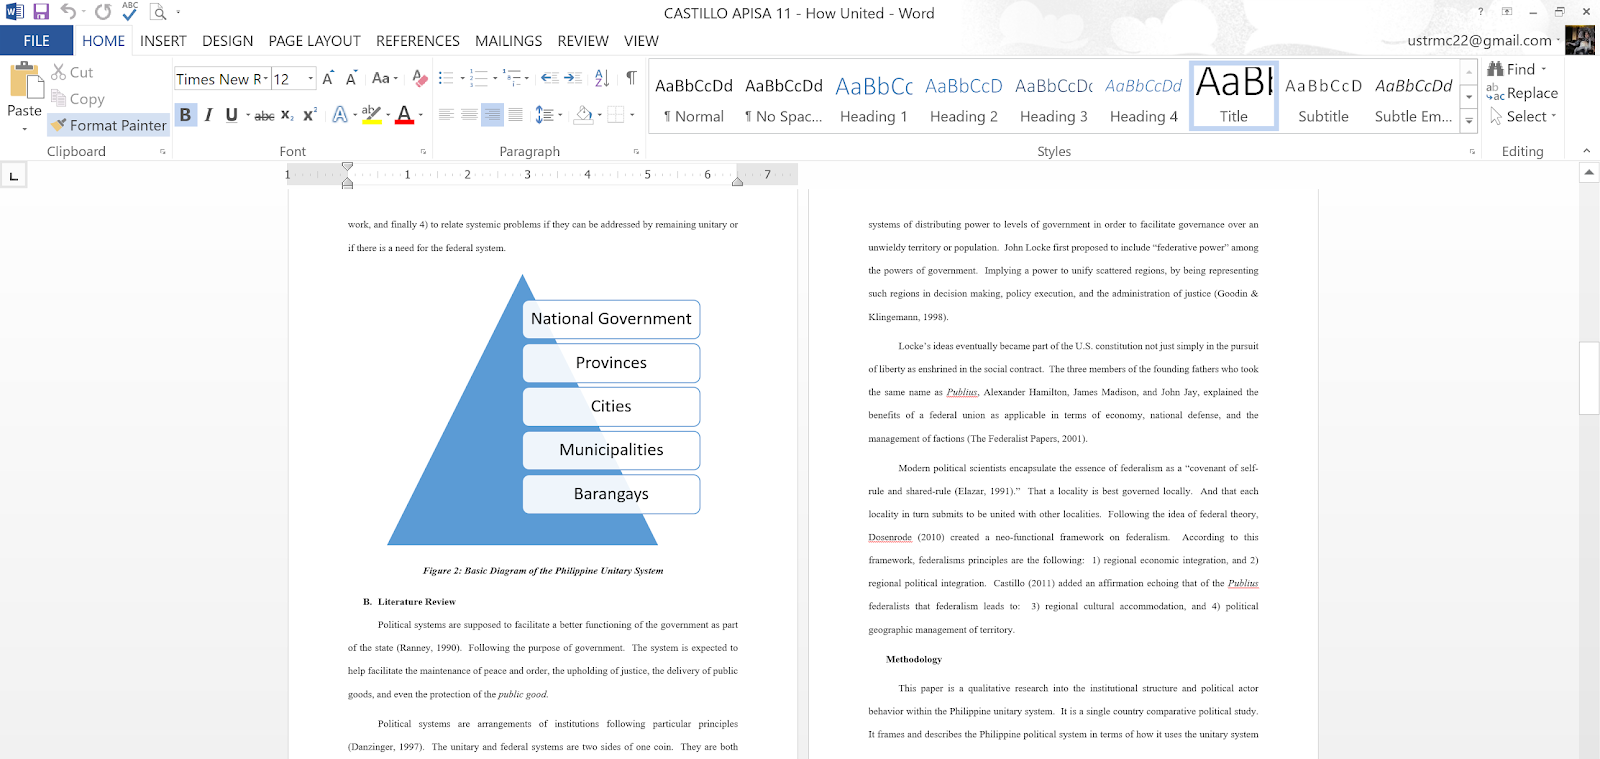
The Simulacrum
You don't put the excel file or even a short version of it into the Chapter IV. What you put there is the illustration of the idea, or a simulacrum. In your thesis, it will be a repeat of your conceptual framework, but this time, with modifications. This is because you were able to find new things from the field which either 1) change the framework into something different, or 2) modify the framework with new or additional concepts. There will also be a possibility of several simulacra to come out of your analysis.
 |
| Sample Framework as used in the paper I presented in Thailand |
 |
| Sample Simulacrum as used in the paper I presented in Thailand. Notice the similarity and difference with the framework. |
PRESENTING THE DATA
This will be how you write chapter IV. The outline will be based on your conceptual framework. Remember, I asked you to tabulate it's concepts with the statement of the problem along with the questionnaire questions.
Hence the outline, generically is. Begin by talking about the simulacra. How many are there? You don't discuss by pointing out the simulacra. You discuss in terms of what are each simulacra about.
As an example. You might have only one simulacra, which is your conceptual framework as applied to your locale. Proceed with it. Make a heading, title it as aligned on what the simulacrum is about. Sometimes, you have more than one simulacrum. E.g. One simulacrum shows the process on how lgbtq organizations influence the political actions of lawmakers. While another simulacrum shows problems encountered by these orgaizations. If this is the case you introduce the chapter by giving a summary list of the general topics wich are what each topic of the simulacra are about.
So, if you have one simulacrum, introduce it. If more than one, make an introduction covering them all, you will not discuss in full. You will give the reader a eneral idea that you have x topics to go over as you progress in the chapter.
Once done introducing, discuss the the simulacrum in full. What is it about. And then follow this with sub-headings. Each subheading corresponding to each part of the simulacrum. E.g. if the simulacrum is about how new infrastructure in rivers affect the lives of fisherfolk, and it shows: a) economic (with sub-theme of * business and * household), safety, and social relations (sub-theme of *inter-fisher folk, *fisher folk and government, * fisher folk and non-government.) Then these will be the same sub-headings. And you will fully, clearly, and in detail, explain each of this. Give examples coming from the field. You describe the life in the field based on these. Then you support what you describe with evidences.
Evidences will be in the form of pictures (pictures from the field, pictures of documents, pictures of conversations), and quotes (the statements that match each of the codes or themes when you thematized ).
Repeat the process with every simulacrum.
You also insert the diagrams of the simulacrum into Chapter IV. Label appropriately, and in the discussions, refer to them. e.g. "as an be seen in Figure 4: Problems Encountered by XXXXXX, there are actually 3 classes or problems.
Very important note. Analysis does not only mean that you thematize only the transcribed files. You can also include there pictures and documents. E.g. you can quote from public documents. or a certain idea from a picture matches a certain theme.
Analysis of Data
Simply presenting the data is not enough. Panel reviewers will look for your analysis. The cool and warm analysis you made earlier is not the full analysis. At that time, you were simply making sense of the text. Now, you have to make sense of the situation in terms of addressing your statement of the problem.
Obviously, the statement of the problem provides the next set of outline for this area of Chapter IV. And no, you don't make the questions into sub-headings. You make single statement answers to the quetions, and make those your sub-headings.
E.g. Your sub-questions are: What other institutions help the barangay in flood mitigation? How do these institutions interact with each other? Based on that, your sub-headings will be:
The 3 Institutions of Succesful Barangay Flood Mitigation
and
Strong Barangay-NGO Partnerships Towards Flood Mitigation
or
Two-Way Network Flow of Resources on Flood Mitigation
Then you discuss each, and again, be clear, be detailed, use samples, paint a clear picture, use evidence, and, also refer to the simulacrum.
The sequence though will be
1st sub question
next
next
last- subquestion
Then the thesis statement (which is the answer to your main statement of the problem).
I hope this was clear enough. But for questions, pls comment here. Don't pm. And don't ever say it's clear when it's not and your just being shy!!!
No comments:
Post a Comment
Start comment with your surname,first name.